Loading DAVIS recordings with events and frames#
Let’s load a sample that contains a tuple of events, inertial measurement unit (IMU) recordings and images.
import tonic

dataset = tonic.datasets.DAVISDATA(save_to="data", recording="shapes_6dof")

data, targets = dataset[0]
events, imu, images = data
Downloading https://download.ifi.uzh.ch/rpg/web/datasets/davis/shapes_6dof.bag to data/DAVISDATA/shapes_6dof.bag
The timestamps for events are from 0 to some 3.4 seconds. We also have timestamps for images, which are regularly sampled.
events["t"]
array([ 0, 494, 648, ..., 59735396, 59735397, 59735406])
images["ts"]
array([ 0, 44064, 88129, ..., 59620440, 59664505, 59708571])
Let’s bin our events into roughly the same time bins. The sampling frequency for images in microseconds can be calculated easily.
import numpy as np

mean_diff = np.diff(list(zip(images["ts"], images["ts"][1:]))).mean()
print(f"Average difference in image timestamps in microseconds: {mean_diff}")
Average difference in image timestamps in microseconds: 44065.366051660516
Say we wanted to apply the same transform to the event frames and grey-level images at the same time. Since the DAVIS dataset has a tuple of data, we have to make use of a helper function to apply our transforms specifically, as we can not apply any single transform to the data tuple at once.
import torch
import torchvision

sensor_size = tonic.datasets.DAVISDATA.sensor_size
frame_transform = tonic.transforms.ToFrame(
    sensor_size=sensor_size, time_window=mean_diff
)

image_center_crop = torchvision.transforms.Compose(
    [torch.tensor, torchvision.transforms.CenterCrop((100, 100))]
)


def data_transform(data):
    # first we have to unpack our data
    events, imu, images = data
    # we bin events to event frames
    frames = frame_transform(events)
    # then we can apply frame transforms to both event frames and images at the same time
    frames_cropped = image_center_crop(frames)
    images_cropped = image_center_crop(images["frames"])
    return frames_cropped, imu, images_cropped
Now we can load the same sample file again, this time with our custom transform function.
dataset = tonic.datasets.DAVISDATA(
    save_to="./data", recording="slider_depth", transform=data_transform
)

data, targets = dataset[0]
frames_cropped, imu, images_cropped = data
Downloading https://download.ifi.uzh.ch/rpg/web/datasets/davis/slider_depth.bag to ./data/DAVISDATA/slider_depth.bag
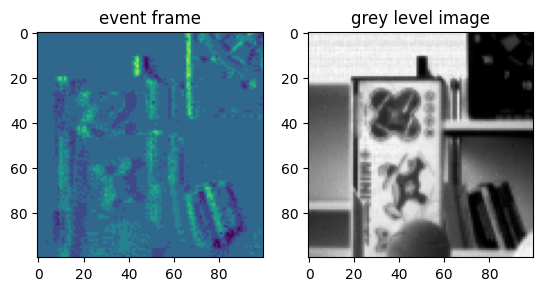
All what’s left is to plot binned event frame and image next to each other.
%matplotlib inline
import matplotlib as mpl
import matplotlib.pyplot as plt

fig, (ax1, ax2) = plt.subplots(1, 2)
event_frame = frames_cropped[10]
ax1.imshow(event_frame[0] - event_frame[1])
ax1.set_title("event frame")
ax2.imshow(images_cropped[10], cmap=mpl.cm.gray)
ax2.set_title("grey level image");

