How can I visualise events?#
Given raw events in the form of a structured numpy array, you might want to plot them in one way or another. Tonic provides two utility methods to do that.
Plotting event grids#
import tonic

nmnist = tonic.datasets.NMNIST("../tutorials/data", train=False)
events, label = nmnist[10]

tonic.utils.plot_event_grid(events, axis_array=(1, 5))
/tmp/ipykernel_895/1277839733.py:6: DeprecationWarning: `product` is deprecated as of NumPy 1.25.0, and will be removed in NumPy 2.0. Please use `prod` instead.
  tonic.utils.plot_event_grid(events, axis_array=(1, 5))

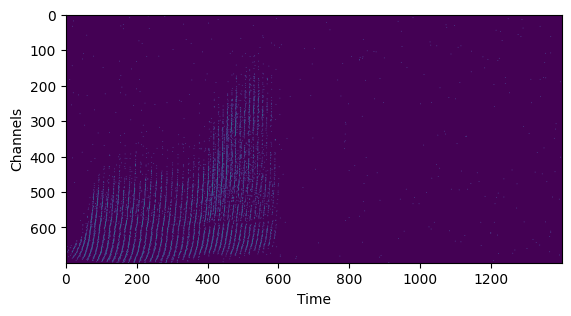
This also works with events from an audio dataset that has (txp) ordering. The axis_array parameter will be ignored in that case.
shd = tonic.datasets.SHD("../tutorials/data", train=False)
audio_events, label = shd[10]

tonic.utils.plot_event_grid(audio_events)
Downloading https://zenkelab.org/datasets/shd_test.h5.zip to ../tutorials/data/SHD/shd_test.h5.zip
Extracting ../tutorials/data/SHD/shd_test.h5.zip to ../tutorials/data/SHD

Plotting event animations#
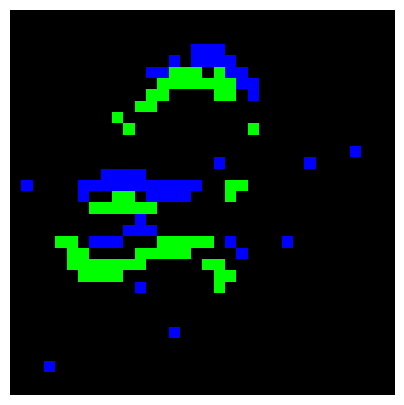
Alternatively, you might want to use a matplotlib animation that gives you more control. You’ll first have to create the frames yourself though. If below example is not rendered correctly, please check out the transform gallery for some example of animated events.
transform = tonic.transforms.ToFrame(
    sensor_size=nmnist.sensor_size,
    time_window=20000,
)

frames = transform(events)

animation = tonic.utils.plot_animation(frames=frames)
Clipping input data to the valid range for imshow with RGB data ([0..1] for floats or [0..255] for integers).

